Network Heatmaps Example
This is a working example of the proposed heatmap data standard for network operators being developed by Ofgem under the LTDS reforms.
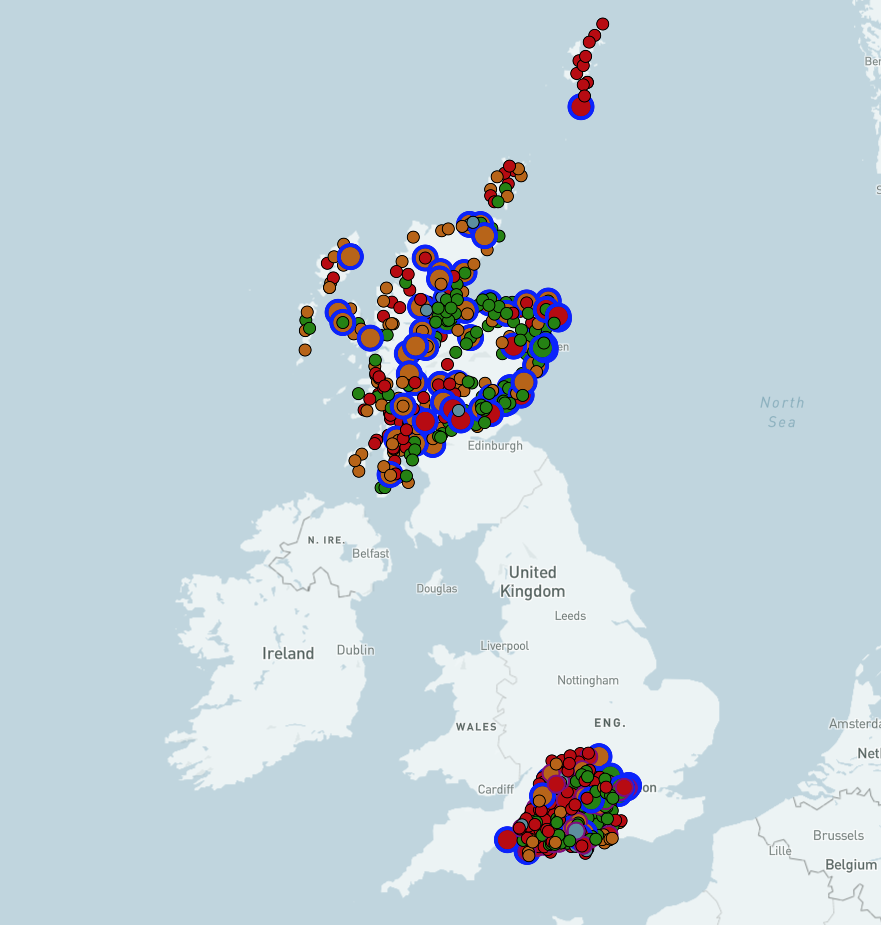
Mapbox Rendering of JSON data
Heatmap Data Format
This example uses JSON serialisation of the data taken from the Network Heatmaps API repository, with the Sample JSON data used directly, converted into GeoJSON with a small Javascript function, then used with Mapbox GL layers to render Substation locations and two example circuits.
Data Source
The data set used is derived from public network demand & generation capacity data supplied by SSEN.
The data set used in this example is not current, and reflects a historical set. It also contains two example circuits in the Perth area that are included for illustration purposes.
Map Rendering
The icons on the map are coloured based on the Red, Amber, Green (RAG) status of the substation based on its generation capacity. The circuits are coloured based on their load capacity. Hovering the mouse over the icon will display all the populated properties of the data set. The properties are all defined in the heatmap data definition documentation.
Source Code
The source code for parsing and displaying the data can be found in the GitHub repository. The Javascript used is embedded within the index.html HTML file.
Alternative Format
The same data can be viewed as an Excel file.
Development & Licensing
This code was developed by Open Grid Systems Ltd in its role as delivery partner to Ofgem for this process. All code is made available under the open source Apache 2.0